现在写程序不像之前只顾着写,能实现功能就行,现在还需要注意性能问题(后来想想其实之前也需要注意,只是自己没想着去注意,也没那个精力/水平去注意实现功能的同时还要保证性能达到标准而已),平时说说也知道有哪些性能指标是需要注意的——CPU(top命令)、内存(top命令)、磁盘I/O(iostat/iotop命令)、网络I/O(nethogs/netstat/ifconfig命令),但是等到真的要对某一程序进行分析了,反而忘了该怎么做才好了o(╯□╰)o
这里就先记录一些分析(指定)程序的性能的指标和方法:
1.top命令的使用
搜索关键字:
http://search.aol.com/aol/search?q=linux+top+sort+by+mem+usage
获取指定进程的CPU、内存使用信息:
$ top -b -p 13354,13452 | grep root #top命令的-p选项(不停的显示,直到Ctrl-C)
$ top -b -n 5 -p 13354,13452 | grep root #运行5次(-n选项)
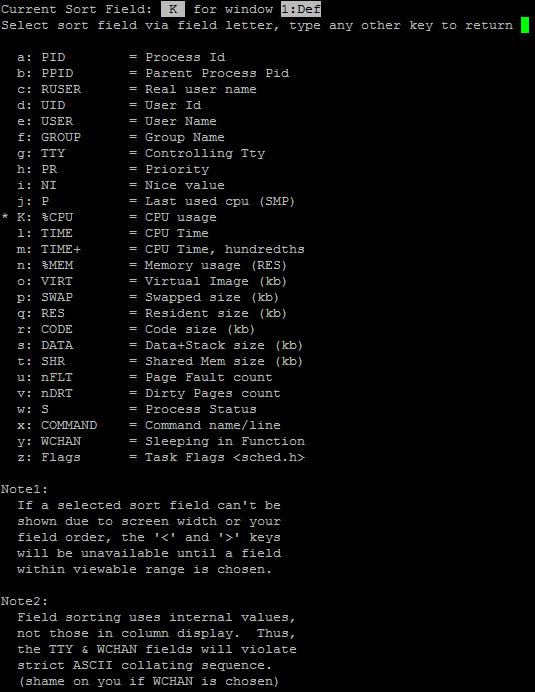
根据特定列进行排序:
steps:
* top
* shift + F
* select a column from the list
e.g. n means sort by memory,
* press enter
* ok
参考链接:
将DATA那一列也显示出来的方法:
进入top命令之后,先按“f”键,然后按“s”键即可。
2.ps命令的使用
搜索关键字:
http://search.aol.com/aol/search?q=linux+ps+get+specify+process+memory+info
$ ps aux --sort rss #从低到高
$ ps aux --sort -rss #从高到低
参考链接:
- http://alvinalexander.com/linux/unix-linux-process-memory-sort-ps-command-cpu
- http://stackoverflow.com/questions/131303/how-to-measure-actual-memory-usage-of-an-application-or-process
- http://www.thegeekstuff.com/2011/04/ps-command-examples/
3.监控网卡流量(网络I/O)
- iftop
- nethogs
- 自己写shell脚本实时监控网卡流量
#!/bin/bash
if [ -z "$1" ]; then
    echo Usage: ./$0 network-interface
    echo Example: ./$0 eth0
    exit
fi
while true
do
    R1=`cat /sys/class/net/$1/statistics/rx_bytes`
    T1=`cat /sys/class/net/$1/statistics/tx_bytes`
    sleep 1
    R2=`cat /sys/class/net/$1/statistics/rx_bytes`
    T2=`cat /sys/class/net/$1/statistics/tx_bytes`
    TBPS=`expr $T2 - $T1`
    RBPS=`expr $R2 - $R1`
    TKBPS=`expr $TBPS / 1024`
    RKBPS=`expr $RBPS / 1024`
    echo -e "Send\t$1: $TKBPS KB/s\nRecv\t$1: $RKBPS KB/s"
done
4.监控磁盘I/O
- iotop
- iostat
- pidstat
《 “在Linux下使用ps/top等命令查看进程的运行情况” 》 有 9 条评论
top命令的设置在不同的操作系统中稍有不同,一般都是在进入top命令之后,先按“h”键,然后再根据提示进行操作即可实现:
·按内存(RES/VIRT)使用进行排序
·按SWAP使用进行排序
·按CPU使用进行排序
·……
Linux下如何获取一个进程的启动时间?
https://stackoverflow.com/questions/5731234/how-to-get-the-start-time-of-a-long-running-linux-process
https://unix.stackexchange.com/questions/62154/when-was-a-process-started
https://unix.stackexchange.com/questions/7870/how-to-check-how-long-a-process-has-been-running
https://superuser.com/questions/380520/how-to-find-uptime-of-a-linux-process
`
# ps -o pid,comm,lstart,etime,time,args -p 3777 #lstart表示启动时间;etime表示消逝的时间
PID COMMAND STARTED ELAPSED TIME COMMAND
3777 auditd Fri Jul 14 17:09:29 2017 2-21:12:54 00:00:00 auditd
#
# stat -c%X /proc/3777 #不是特别准确,但相差也不大
1500023370
# date -d@1500023370
Fri Jul 14 17:09:30 CST 2017
`
使用atop排查 谁引起了CPU小尖峰
http://bean-li.github.io/CPU-sharp-pulse/
atop 获取进程退出信息
http://bean-li.github.io/atop-exit-code/
Linux中ps aux、ps -aux、ps -ef之间的区别
http://blog.csdn.net/tanga842428/article/details/79292634
http://www.cnblogs.com/yinxiangpei/articles/5053840.html
`
ps aux 和 ps –aux ,使用时两者之间直接选择 ps aux
ps aux 和 ps -ef 两者的输出结果差别不大,但展示风格不同。aux是BSD风格,-ef是System V风格。这是次要的区别,一个影响使用的区别是aux会截断command列,而-ef不会。当结合grep时这种区别会影响到结果。
`
类似于top命令的容器状态信息查询工具(Golang)
Top-like interface for container metrics (ctop provides a concise and condensed overview of real-time metrics for multiple containers)
https://github.com/bcicen/ctop
进程监控的更好解决方案-god
https://briteming.blogspot.com/2018/05/god.html
https://www.jianshu.com/p/c948585ef41e
https://ruby-china.org/topics/21354
https://github.com/mojombo/god
`
God是一个用Ruby写成的,容易配置,容易扩展的服务器监控框架。
保持你的服务器的程序和任务运行应该是你部署过程中简单的一部分。God的目标:做最简单、功能最强的监控应用程序。
`
God进程监控框架
http://noops.me/?p=133
Process monitoring tool. Inspired from Bluepill and God.
https://github.com/kostya/eye
Full command text with unix ps
https://superuser.com/questions/486648/full-command-text-with-unix-ps/665008#665008
`
$ man ps
-w Use 132 columns to display information, instead of the default which is your window size. If the -w option is specified more than once, ps will use as many columns as necessary without regard for your window size. When output is not to a terminal, an unlimited number of columns are always used.
使用132列来显示信息,而不是默认的窗口大小。如果多次指定-w选项,ps将使用足够多的列,而不考虑窗口大小。当输出不是到终端时,总是使用无限数量的列。
ps aux
ps auxww
ps aux | less
`
top命令的使用
How to display `top` results sorted by memory usage in real time?
https://unix.stackexchange.com/questions/128953/how-to-display-top-results-sorted-by-memory-usage-in-real-time
`
进入top命令的界面之后,按下 h 键弹出帮助文档,下面捡几个最近了解到的有用的指令记录一下
1
f #按下之后会进入字段显示管理的界面,上下键用于导航,s用于指定排序的键,d用于显示或不显示列,q用于回到主界面(默认是根据CPU使用排序,但有些时候需要根据内存使用情况排序,还是很有用的)
x #用于高亮显示当前排序的列
k #用于杀掉指定任务,键入k之后会提示你输入pid,默认是当前排第一的pid,(Send pid xxx signal [15/sigterm])
L #用于进行任务定位,根据输入字符串进行查找(但是实际使用还是建议先退出去)
Help for Interactive Commands – procps-ng version 3.3.10
Window 1:Def: Cumulative mode Off. System: Delay 3.0 secs; Secure mode Off.
Z,B,E,e Global: ‘Z’ colors; ‘B’ bold; ‘E’/’e’ summary/task memory scale
l,t,m Toggle Summary: ‘l’ load avg; ‘t’ task/cpu stats; ‘m’ memory info
0,1,2,3,I Toggle: ‘0’ zeros; ‘1/2/3’ cpus or numa node views; ‘I’ Irix mode
f,F,X Fields: ‘f’/’F’ add/remove/order/sort; ‘X’ increase fixed-width
L,&, . Locate: ‘L’/’&’ find/again; Move sort column: ” left/right
R,H,V,J . Toggle: ‘R’ Sort; ‘H’ Threads; ‘V’ Forest view; ‘J’ Num justify
c,i,S,j . Toggle: ‘c’ Cmd name/line; ‘i’ Idle; ‘S’ Time; ‘j’ Str justify
x,y . Toggle highlights: ‘x’ sort field; ‘y’ running tasks
z,b . Toggle: ‘z’ color/mono; ‘b’ bold/reverse (only if ‘x’ or ‘y’)
u,U,o,O . Filter by: ‘u’/’U’ effective/any user; ‘o’/’O’ other criteria
n,#,^O . Set: ‘n’/’#’ max tasks displayed; Show: Ctrl+’O’ other filter(s)
C,… . Toggle scroll coordinates msg for: up,down,left,right,home,end
k,r Manipulate tasks: ‘k’ kill; ‘r’ renice
d or s Set update interval
W,Y Write configuration file ‘W’; Inspect other output ‘Y’
q Quit
( commands shown with ‘.’ require a visible task display window )
Press ‘h’ or ‘?’ for help with Windows,
Type ‘q’ or to continue
`